Some statistics about Vincennes' half marathon (2022)
In 2022, I ran Vincennes’ half marathon with a friend.
After the race, I was curious to know how I did compared to other participants. Fortunately, the results were made available online at https://protiming.fr/Results/runningR/6294/14/.
I figured out a way of paginating through the results after having clicked a few buttons. Adding page:N at the end of the URL seemed to be good enough.
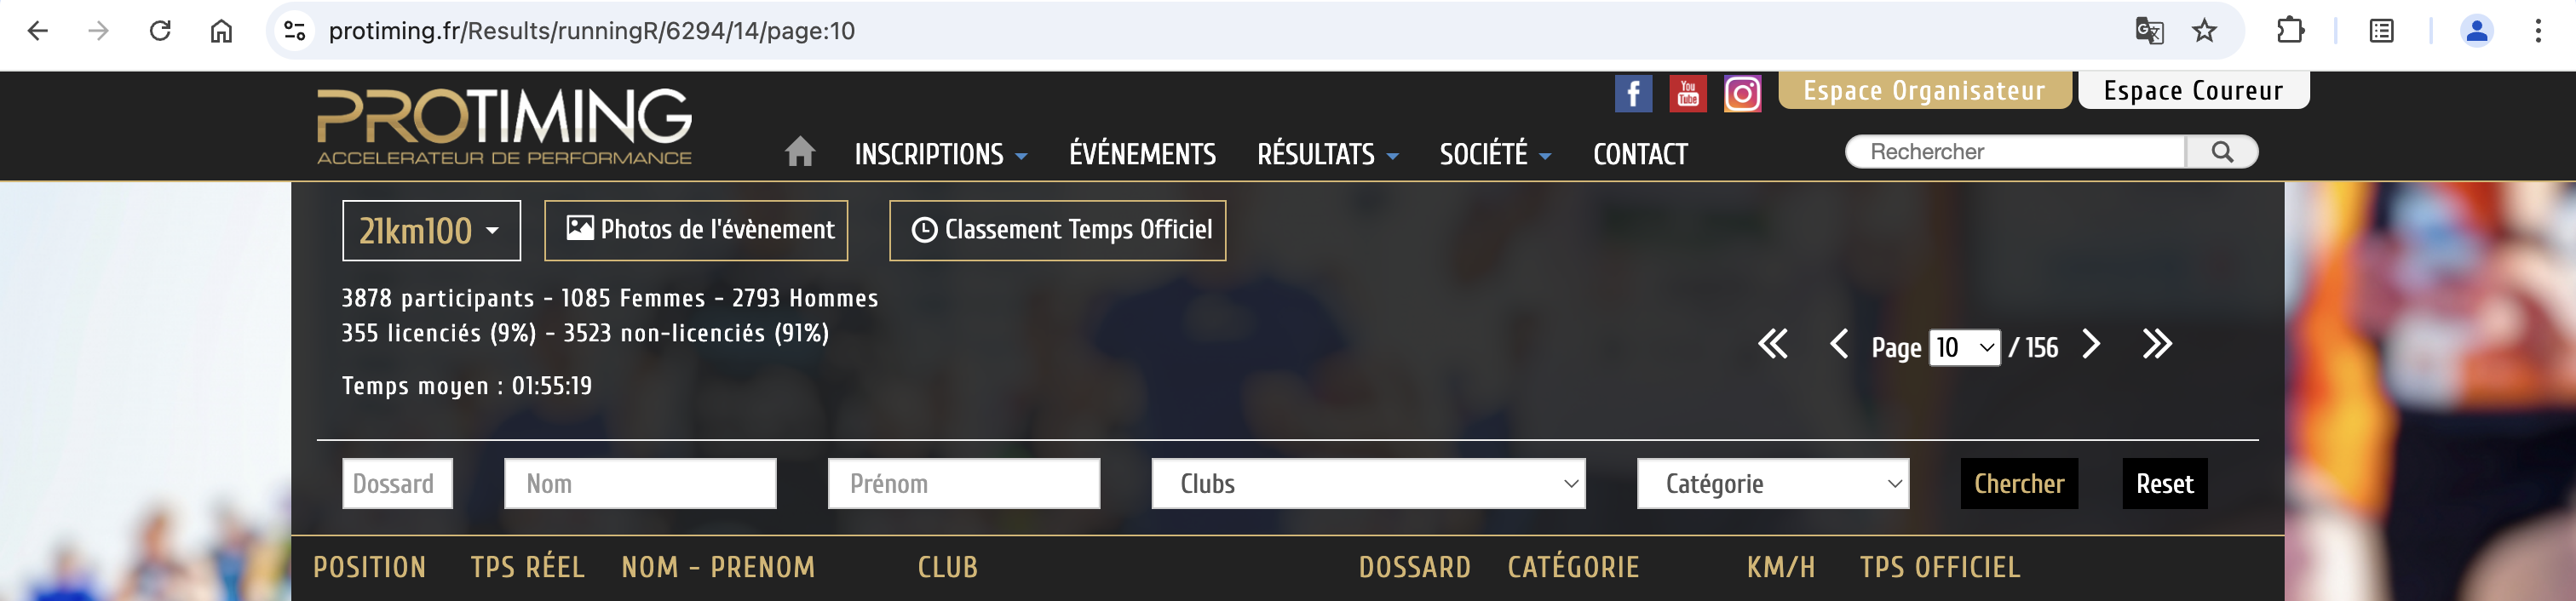
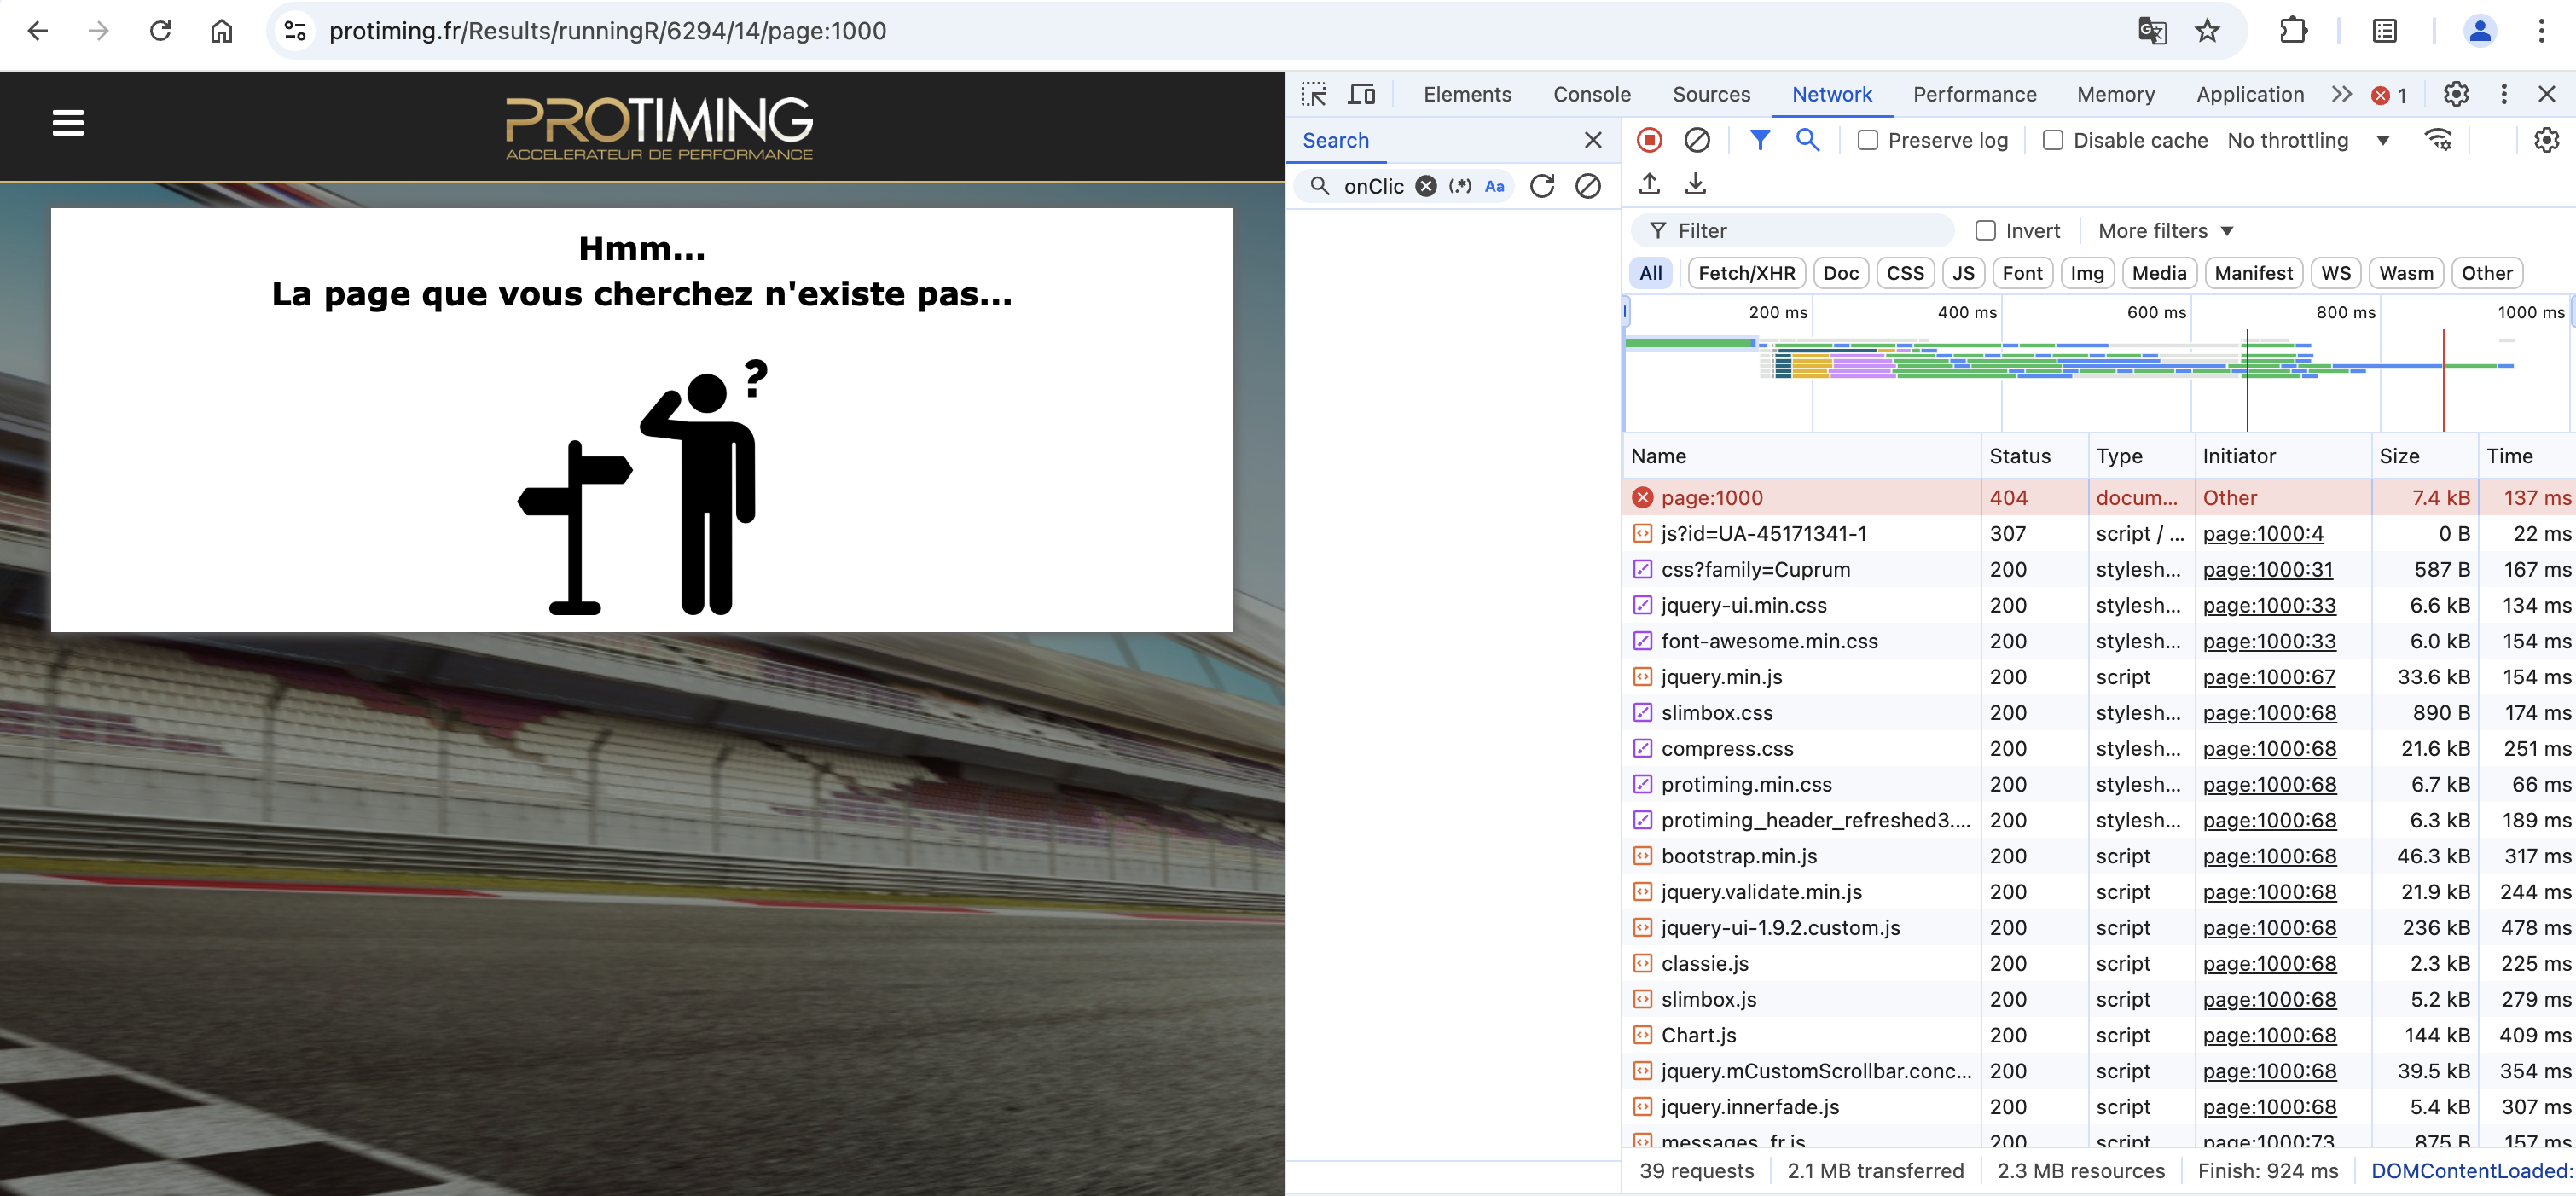
When the page number exceedes the last one, the website returns a 404 HTTP status code so it’s easy to know when to stop iterating.
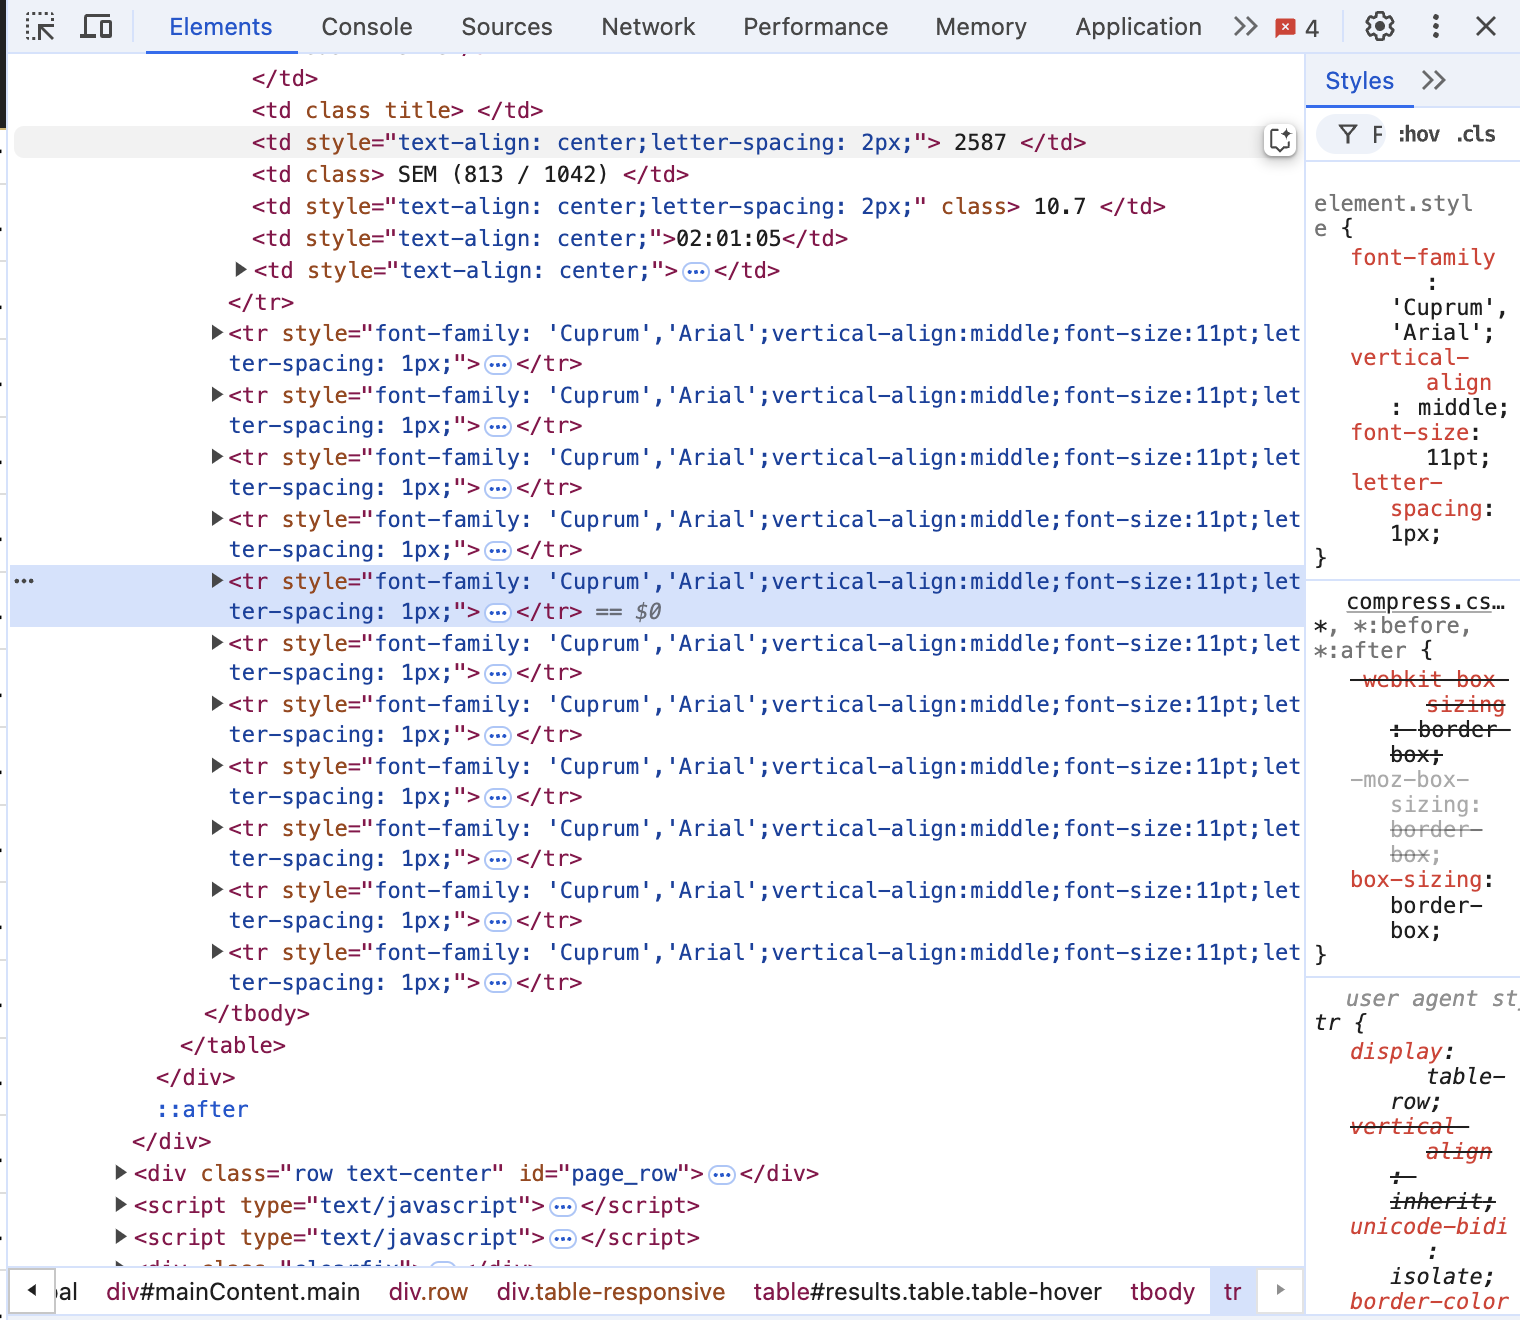
After spending some time inspecting the page source code, I came up with the following Python script:
import requests
import json
from bs4 import BeautifulSoup


URL = "https://protiming.fr/Results/runningR/6294/14/page:{}"
DATASET = "data.json"


def get_dataset():
    times = []

    for page in range(1, 156):
        response = requests.get(URL.format(page))
        soup = BeautifulSoup(response.text, features="html.parser")
        for row in soup.find(id="results").find("tbody").find_all("tr"):
            times.append({
                "time": sum(x * int(t) for x, t in zip([3600, 60, 1], row.find("td", {"class": "real_time_data"}).text.split(":"))),
                "category": row.find_all("td")[5].text.strip().lower(),
            })

    return times


def main():
    data = get_dataset()

    with open(DATASET, "w") as f:
        json.dump(data, f)


if __name__ == "__main__":
    main()
I used the famous BeautifulSoup Python library to extract HTML tags of interest and saved the whole results as a JSON with the following format:
[
    {
        "time": 4209, // in seconds
        "category": "m0m (1 / 454)"
    },
    [...]
]
I only cared about people’s time and their category. This latest field is a string formatted in a way you can extract the sex and age of the participant. For instance, when the second character is a m, the record is for a male, and similarly, f indicates a female.
Once I had the dataset locally (I did not want to DOS the website by scrapping it too often), I could start playing with it.
I was mostly interested in drawing the general histogram of times, and then one for each sex. I ended up with the following code:
import json
import matplotlib.pyplot as plt


DATASET = "data.json"


def load_dataset():
    with open(DATASET, "r") as f:
        return json.load(f)


def group_by_sex(data):
    women = []
    men = []

    for datum in data:
        if datum["category"][2] == "f":
            women.append(datum)
        elif datum["category"][2] == "m":
            men.append(datum)

    return women, men


def display_histogram(data, bins=200):
    plt.hist([point["time"] for point in data], bins=bins)
    plt.show()


def main():
    data = load_dataset()

    display_histogram(data)

    groups = group_by_sex(data)

    for group in groups:
        display_histogram(group)


if __name__ == "__main__":
    main()
This allowed to generate the following histograms: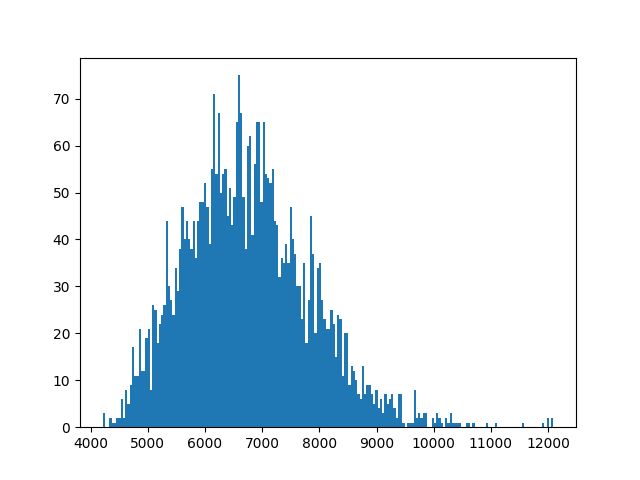
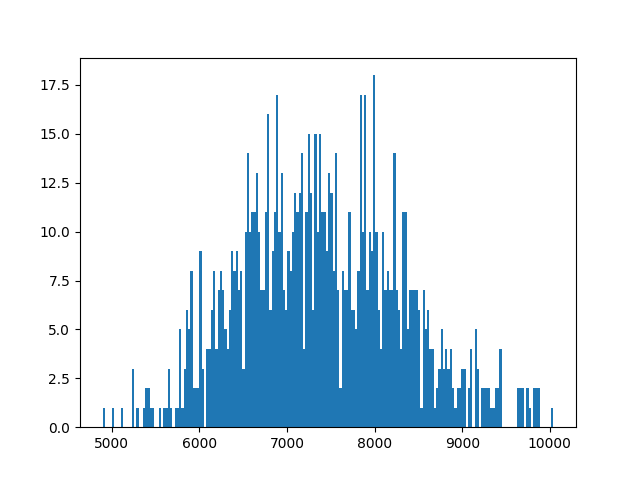
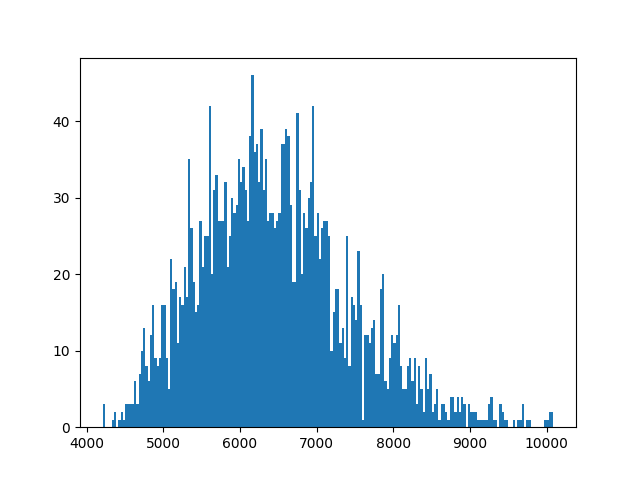
With my time (1:46:56, therefore 6416 seconds) it ended up I’m pretty average ˆˆ
See you next time 👋